
Key Takeaways
Start here if you want the shortest version of this article.
- ✓ Against two tertiary-hospital DEXA setups (dual-energy X-ray absorptiometry, the gold standard), the BestHealth solution is highly consistent on muscle mass (r=0.978-0.983).
- ✓ Against marketed professional BIA comparison devices, fat-free mass, skeletal muscle mass, fat mass and body-fat percentage correlate 0.978-0.995.
- ✓ In dual-hospital DEXA cross-validation, the device-vs-DEXA muscle agreement (0.978-0.983) sits in the same magnitude as the two DEXA setups' mutual agreement (0.992) - the result is reliable and reproducible.
- ✓ Multiple customers' body composition analyzers built on the BestHealth solution have obtained NMPA Class II medical device registration; contact us for certification support.
The previous article, How to Validate Body Composition Accuracy - A DEXA Comparison Methodology, covered the validation method: which metrics to use, how to choose the cohort, and how to control the procedure. This article publishes actual comparison results from a 100-person cohort for the BestHealth body composition solution, focusing on two questions: agreement with tertiary-hospital DEXA as the gold-standard reference, and consistency with marketed BIA comparison devices. It is intended for manufacturers evaluating BestHealth modules and preparing accuracy-validation materials.
About the data
This article publishes same-period comparison validation results from a 100-person cohort (n=100) for the BestHealth body composition solution. Reference methods include tertiary-hospital DEXA and marketed BIA comparison devices; Pearson correlation coefficient r is the primary statistical metric shown, and all correlations are significant at p<0.0001.
Third-party device note
InBody and related model names are trademarks of their respective owners. They are mentioned only to identify the third-party comparison devices used in this validation. This does not imply any cooperation, authorization, sponsorship or endorsement between BestHealth and that brand.
How the validation was done
On one cohort of 100 people, this validation ran same-period measurements against two kinds of reference:
- Gold standard: DEXA (dual-energy X-ray absorptiometry) at two tertiary hospitals - a commonly used reference method for body composition, used to evaluate agreement with the gold-standard reference. Using two hospitals rather than one also provides a reference for “gold standard vs gold standard” agreement.
- Professional BIA comparison devices: InBody 270 / 570 - used to evaluate consistency between the BestHealth solution and marketed professional BIA device outputs.
Each subject was measured on every device within as close a time window as possible, under controlled conditions; raw impedance and each device’s output were all logged, then Pearson correlation r, coefficient of determination and bias were computed per metric. The results below come in two parts: vs the tertiary-hospital DEXA gold standard (including dual-hospital cross-validation), and vs professional BIA comparison devices.
1. Comparison with tertiary-hospital DEXA (gold standard) and cross-validation
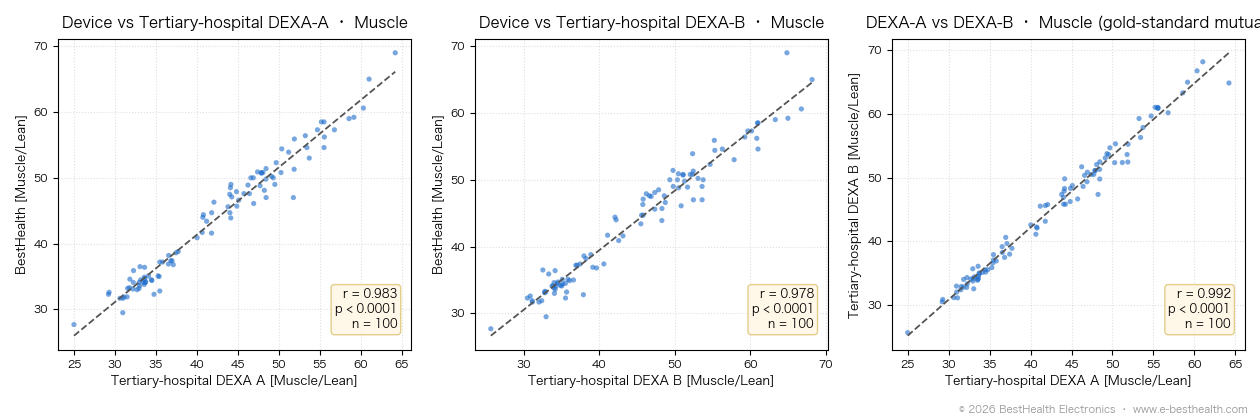
First, the comparison against the clinical gold standard. On the core body-composition metric of muscle / lean mass, the BestHealth solution is highly consistent with both tertiary-hospital DEXA setups; at the same time, the mutual test between the two DEXA setups gives a reproducible reference ceiling for this correlation:
| Comparison | Metric | Correlation r | Bias | Sample |
|---|---|---|---|---|
| BestHealth solution vs tertiary-hospital DEXA-A | Muscle / lean mass | 0.9833 | +1.40 kg | 100 |
| BestHealth solution vs tertiary-hospital DEXA-B | Muscle / lean mass | 0.9782 | -1.06 kg | 100 |
| Tertiary-hospital DEXA-A vs DEXA-B (gold-standard mutual) | Muscle mass | 0.992 | +2.46 kg | 100 |
| BestHealth solution vs tertiary-hospital DEXA-A | Fat mass | 0.957 | -2.24 kg | 100 |
| BestHealth solution vs tertiary-hospital DEXA-B | Fat mass | 0.954 | -1.59 kg | 100 |
| Tertiary-hospital DEXA-A vs DEXA-B (gold-standard mutual) | Fat mass | 0.981 | -0.65 kg | 100 |
A / B identify two different tertiary-hospital DEXA references. Device rows show “device - DEXA” bias; mutual-test rows show “DEXA-B - DEXA-A” bias.
The muscle-mass triptych above (left to right): BestHealth vs tertiary-hospital DEXA-A (r=0.983), vs DEXA-B (r=0.978), and the mutual test between the two DEXA setups (r=0.992).
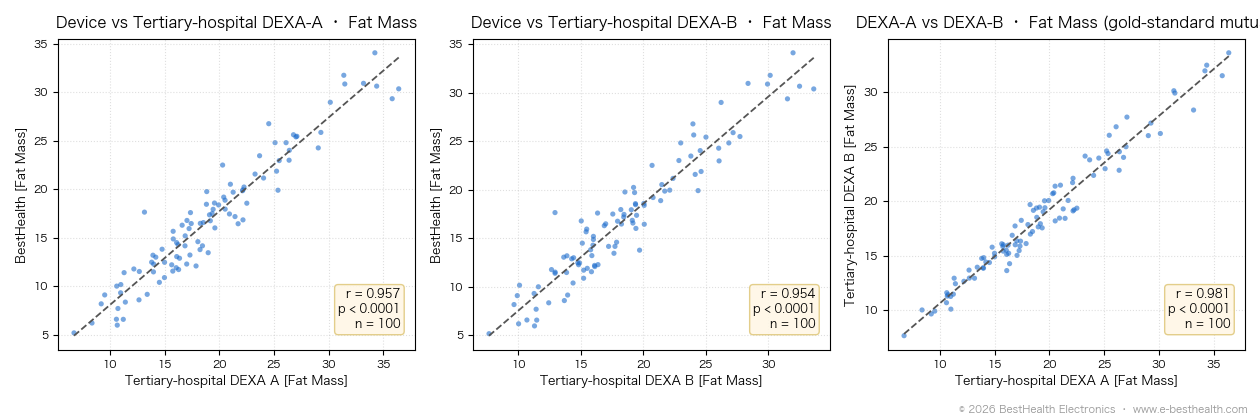
The fat-mass triptych above (same structure as muscle mass): BestHealth vs tertiary-hospital DEXA-A (r=0.957), vs DEXA-B (r=0.954), and the mutual test between the two DEXA setups (r=0.981).
The key point: two DEXA gold standards do not agree at 1.000 with each other either (muscle mass 0.992, fat mass 0.981), and the BestHealth-vs-DEXA agreement - muscle mass 0.978-0.983, fat mass 0.954-0.957 - already sits in the same magnitude as “gold standard vs gold standard.” This means the device output tracks true body-composition changes highly consistently with the gold standard, and the correlation has a reproducible reference frame. For manufacturers preparing accuracy-validation materials, this dataset can serve as a core reference.
2. Comparison with professional BIA devices
DEXA is used to assess agreement with the gold-standard reference; professional BIA devices show how close the results are to marketed professional solutions. In this validation, comparison against InBody270 / 570 produced the following correlations:
| Metric | vs InBody270 | vs InBody570 |
|---|---|---|
| Fat-free mass (FFM) | 0.995 | 0.995 |
| Skeletal muscle mass (SMM) | 0.995 | 0.993 |
| Fat mass | 0.988 | 0.989 |
| Body-fat % | 0.979 | 0.978 |
The two figures below show fat-free mass, skeletal muscle mass and fat mass against InBody270 and InBody570 respectively (n=100); body-fat percentage is in the table above.
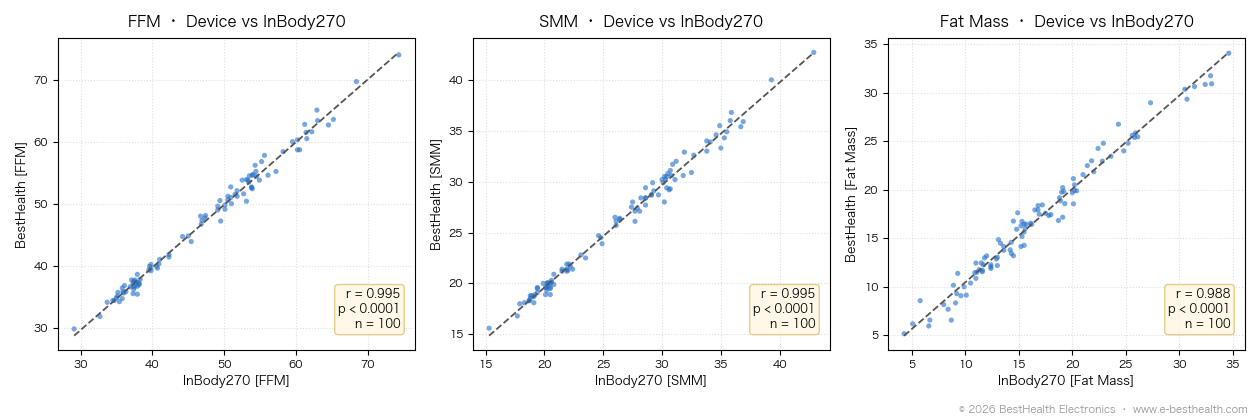
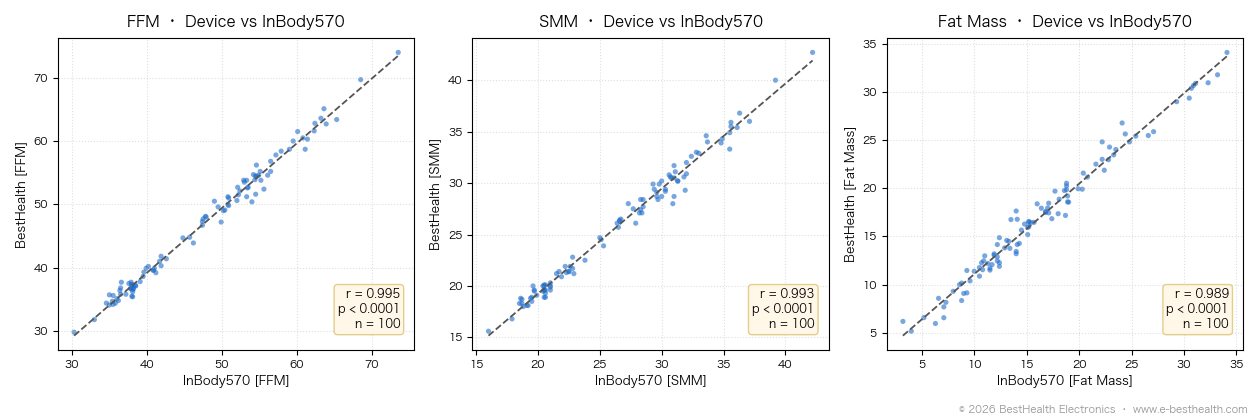
Fat-free mass 0.995, skeletal muscle mass 0.993-0.995, fat mass 0.988-0.989, and body-fat percentage 0.978-0.979. These results indicate high consistency between the BestHealth solution and the professional BIA comparison devices used in this validation on major outputs such as fat-free mass, muscle, fat and body-fat percentage.
From validation data to mass-production certification
Beyond the comparison data above, multiple customers’ body composition analyzers built on the BestHealth solution have obtained NMPA Class II medical device registration - so this solution is not only consistent with the gold standard on the data, it has also been proven through real NMPA Class II registration. If your product needs certification, we can provide the corresponding test data and technical support, and named case materials where authorized; for more certification-support information, please contact us.
How to cite the results
These results can support solution evaluation, customer technical discussions and marketing-material preparation. If you build a product on BestHealth modules, the lines below can be adapted directly into your own materials for your customers and channels - keep the sample size, comparison method and metric names together so the data scope is clear and holds up to scrutiny:
- “A body composition analyzer using the BestHealth solution, validated against tertiary-hospital DEXA (n=100): muscle mass correlation 0.978-0.983, p<0.0001 - highly consistent with the clinical gold standard on muscle / lean mass.”
- “Versus third-party professional BIA comparison devices (n=100): fat-free mass 0.995, skeletal muscle mass 0.993-0.995, fat mass 0.988-0.989, body-fat % 0.978-0.979.”
- “In dual-hospital DEXA cross-validation, the device-vs-DEXA muscle agreement (0.978-0.983) sits in the same magnitude as the two DEXA setups’ mutual agreement (0.992).”
To understand the metric choices, cohort design and procedure control behind this validation, see How to Validate Body Composition Accuracy - A DEXA Comparison Methodology; for troubleshooting correlation anomalies, see How to Troubleshoot BIA Body Composition Measurement Anomalies from Impedance Data.
For the full validation dataset, per-metric reports, or a comparison plan tailored to your target population, please contact us. Related modules: BMH05108, BMH05104-2, BMH05109.
Previous
BIA Body Composition Measurement Principles and Four / Eight-Electrode Selection
Next
Body Composition Module Quick Selection - Product Fit, Accuracy Difference, and Integration
Related Articles
Continue with articles covering adjacent engineering topics and implementation details.
Solution Evaluation
How to Validate Body Composition Accuracy - A DEXA Comparison Methodology
For manufacturers building body composition products on the BMH05104-2 / BMH05108 / BMH05109 modules who need to prove "it measures accurately" to customers or the market, this guide explains why to use DEXA as the gold standard, what BIA accuracy validation should prove, why this article uses correlation as the main validation metric while bias and reproducibility can serve as supplemental analysis, how to design the validation cohort (sample size, gender, age and body-type coverage), how to control measurement conditions, and common pitfalls such as treating a same-type BIA device as the gold standard or hospital DEXA only reporting bone density.
June 15, 2026
Solution Evaluation
Body Composition Module Quick Selection - Product Fit, Accuracy Difference, and Integration
For product managers, buyers and engineering teams new to the BestHealth body composition solution, this article first answers four first-pass questions: which modules are available, what product each fits, how much accuracy differs between four-electrode and eight-electrode solutions, and how to integrate the module into the finished device. It then compares BMH05104-2, BMH05108 and BMH05109, and explains what makes a strong body composition solution: a self-designed BIA measurement front end, validation data, certification support, SDK/API completeness, structural design support and response speed.
June 26, 2026
Body Composition Principles
BIA Body Composition Measurement Principles and Four / Eight-Electrode Selection
Starting from the conductivity principle, this guide explains how BIA measures body composition, what the resistance and reactance inside impedance represent, why a four-electrode setup is required instead of two, and the difference between single and multiple frequencies. It then compares four-electrode (two-leg / two-arm) and eight-electrode (segmental) approaches by measurement path, output items, accuracy, cost, and product form, to help you pick the right approach and module for scales, wearables, and professional analyzers.
June 15, 2026
BestHealth
Need technical support for your next project?
Share your application scenario and target requirements. Our team can help with device selection and solution planning.